
Lesson 4 - Debugging in the Visual Studio Code development environment
In the previous lesson, Program debugging and breakpoints, we tuned a small program in JavaScript. We also explained what a debugger is and we know what breakpoints are.
Various development environments offer us already integrated debugging tools directly or through extensions. In this lesson, we will look at Visual Studio Code. We will show how we can use it for debugging and replace most of the tools that we had to look for in the browser. We achieve higher productivity, speed, and comfort. Although we will talk about a specific program, similar functions exist in almost all development environments.
We will use the code from the last lesson for an example. If you do not have it, I enclose it here:
<!DOCTYPE html>
<html>
    <head>
        <title>Addition App</title>
        <script src="script.js"></script>
        <meta charset="utf-8">
    </head>

    <body>
        <p>Number 1</p>
        <input id="a" type="number">

        <p>Number 2</p>
        <input id="b" type="number"> <br /> <br />

        <input class="button" type="button" onclick="add()" value="Add up">
        <p id="result">0</p>
    </body>
</html>
JS:
function add() {
    let number1 = document.getElementById("a").value;
    let number2 = document.getElementById("b").value;

    document.getElementById("result").innerHTML = parseInt(number1) + parseInt(number2);
}
The code is available to download at the end of the lesson.
Visual Studio Code
Visual Studio Code is a source code editor developed by Microsoft. It is available on both Windows and Linux or macOS operating systems. The software is free and, interestingly, it is programmed in JavaScript and TypeScript languages. We can download it via the official website code.visualstudio.com. Installation is simple, just click on the license conditions and then choose the path where the program should be installed. It is also advisable to uncheck the options for adding a shortcut to the context menu (right-click on a file or folder). After right-clicking on a folder, we can open the folder in VS Code and we do not have to manually search for the path after turning on the program. VS Code itself is "useless", but using extensions allows us to transfer most tools directly to the development environment and thus support various languages, shortcuts, and more. Let's set it up now.
Environment settings
We must first open our working folder. I remind you that the files are from
the last lesson and can also be downloaded below the article. We will start
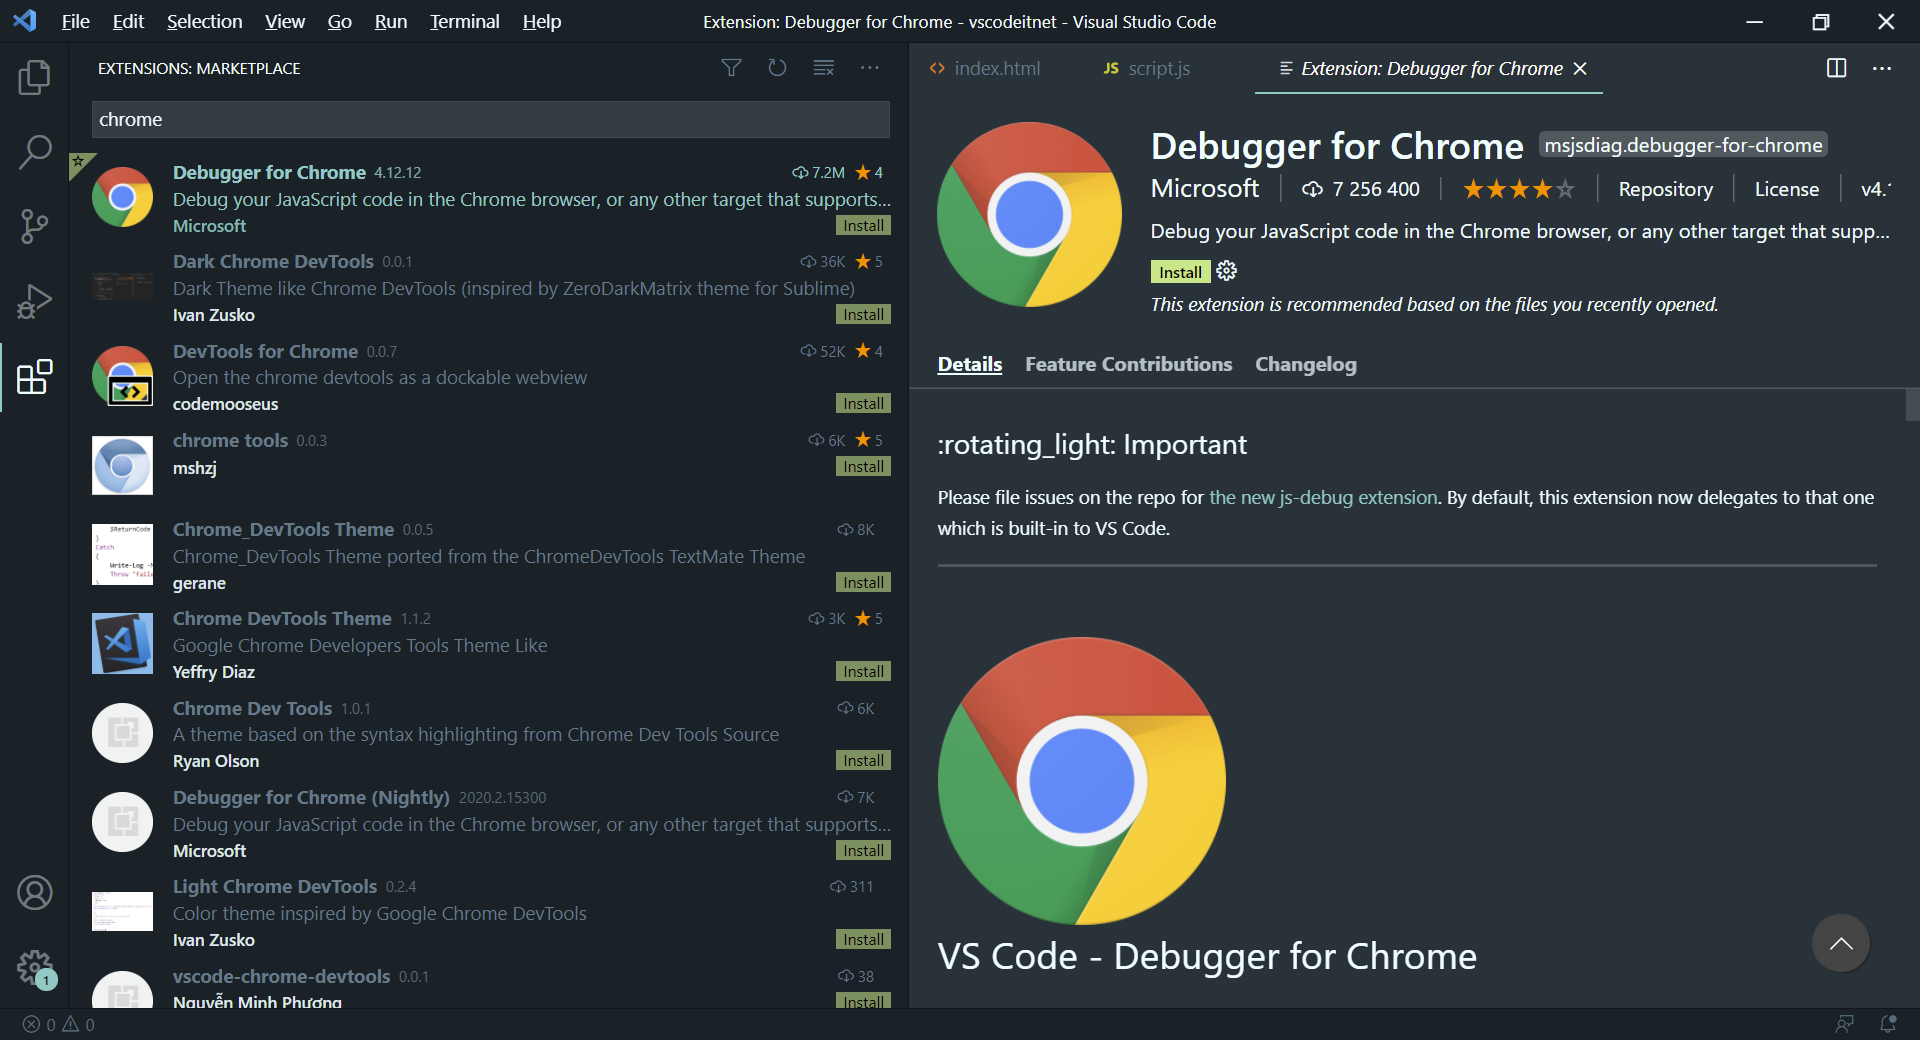
searching for the extension menu by clicking on the last icon on the left. The
menu can also be expanded using the keyboard shortcut Ctrl +
Shift + X. Then we type chrome into the
search and install the Debugger for Chrome with millions of
downloads:
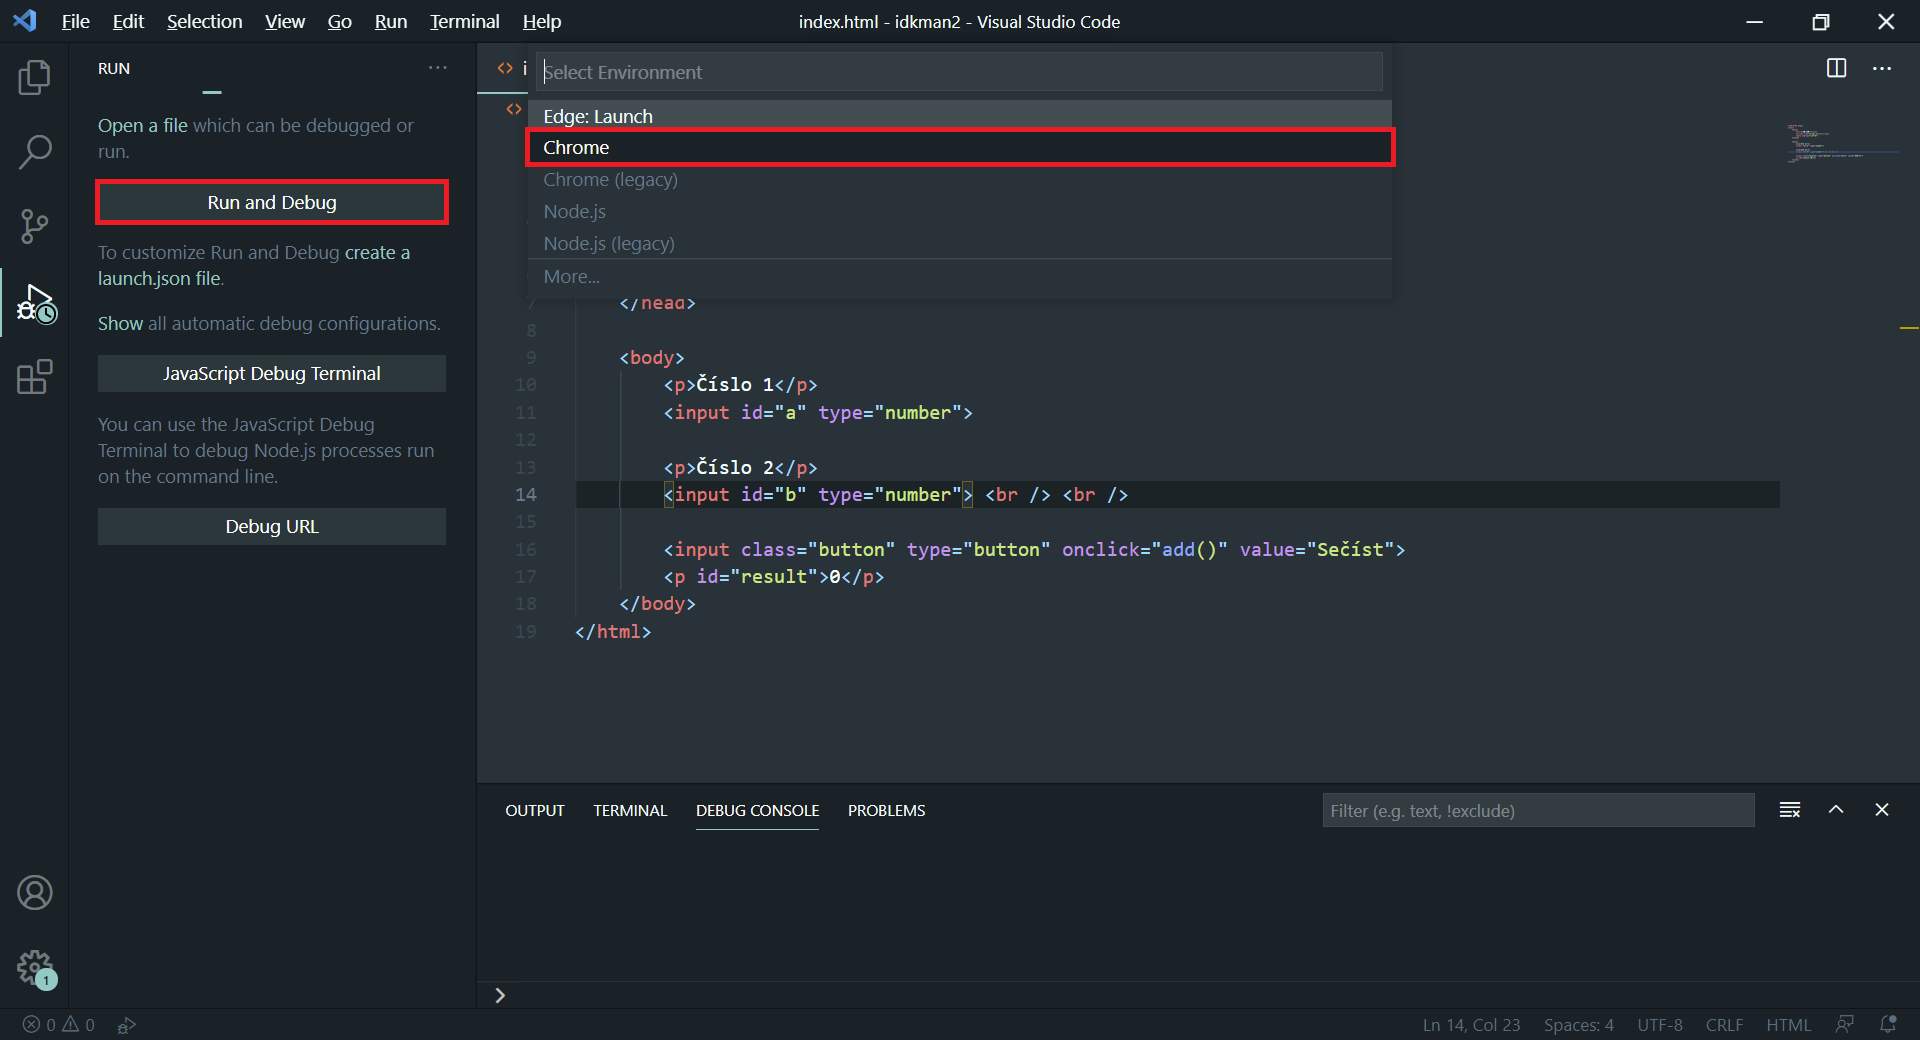
Next, you need to set up the debugger itself. Run section on the
left (keyboard shortcut Ctrl + Shift + D) and
click on the blue Run and Debug button. Then we choose the
Chrome option:
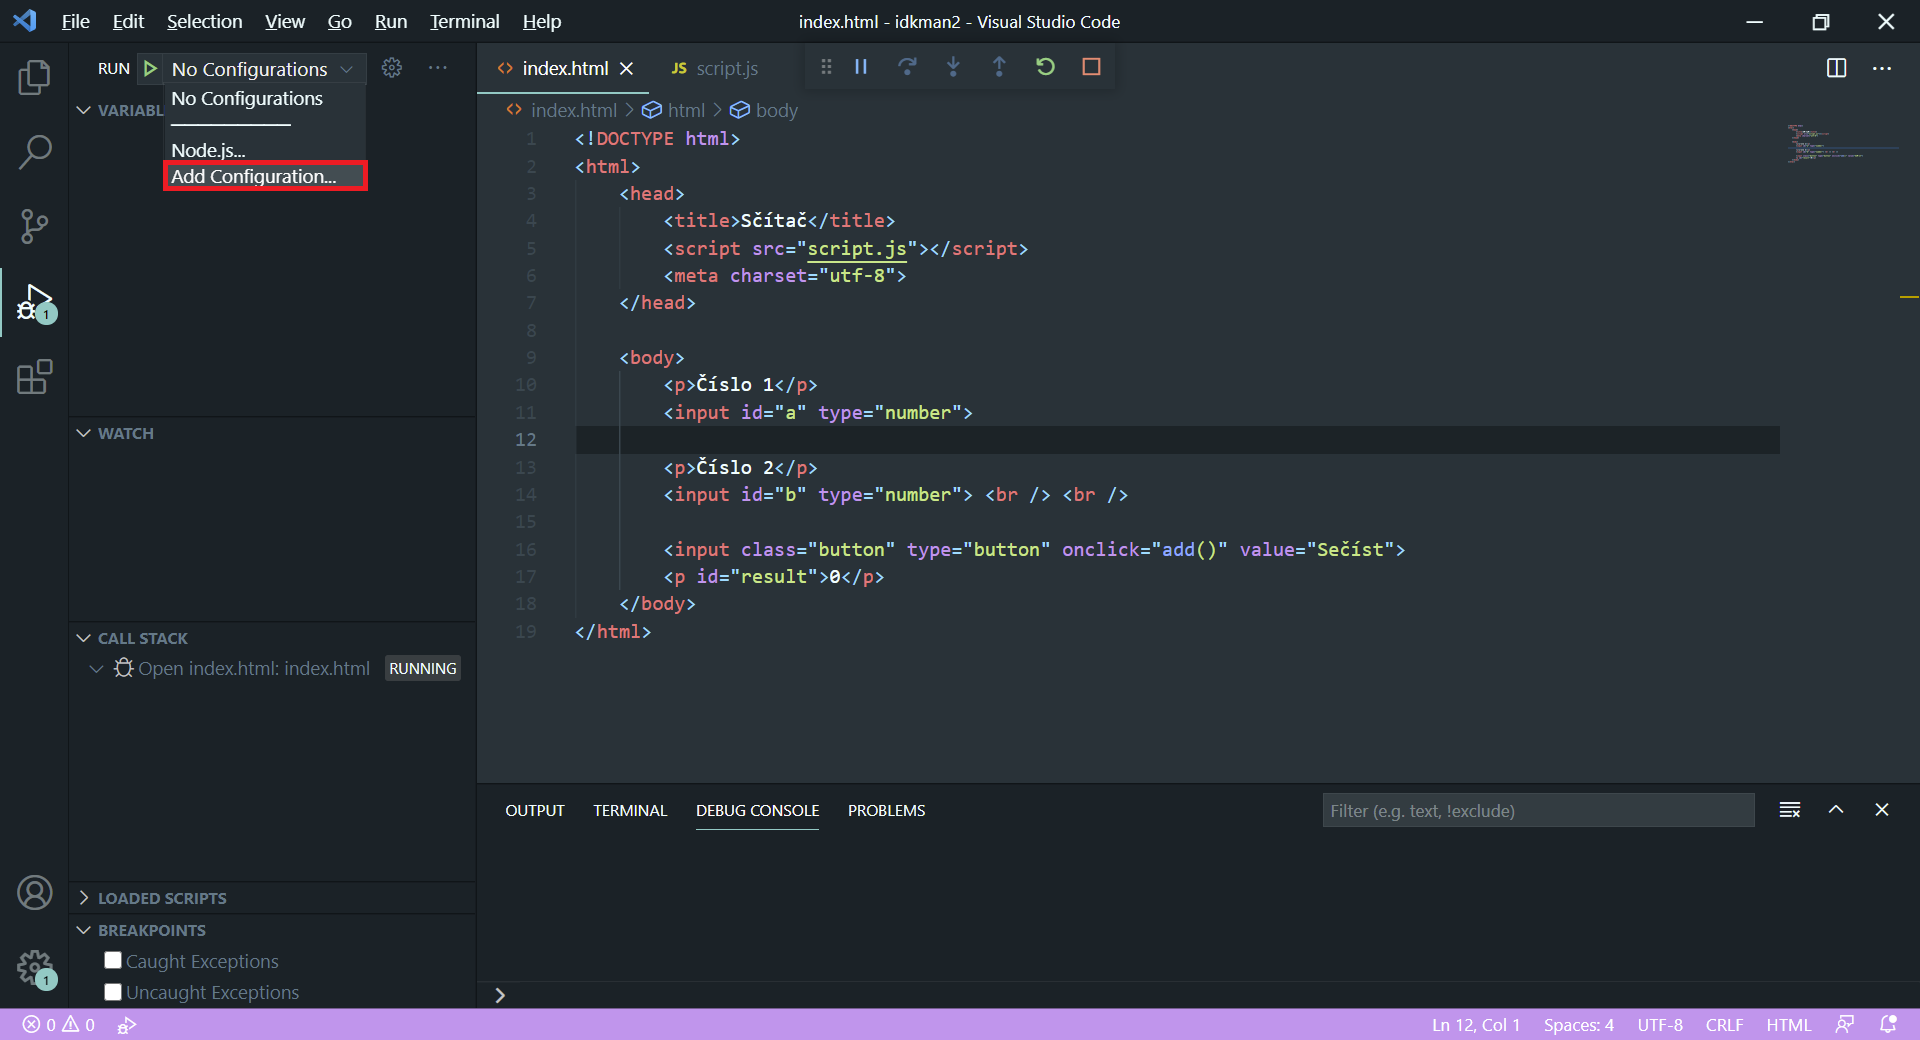
Now there is nothing left but to select Add configuration… after clicking on the arrow. (This menu may not be necessary at all the first time you run it, instead, the IDE will ask you if you want to create a configuration.) Then select Chrome again:
We will also see the editing of the launch.json file. Let's take the parameters into account and check that everything is in order:
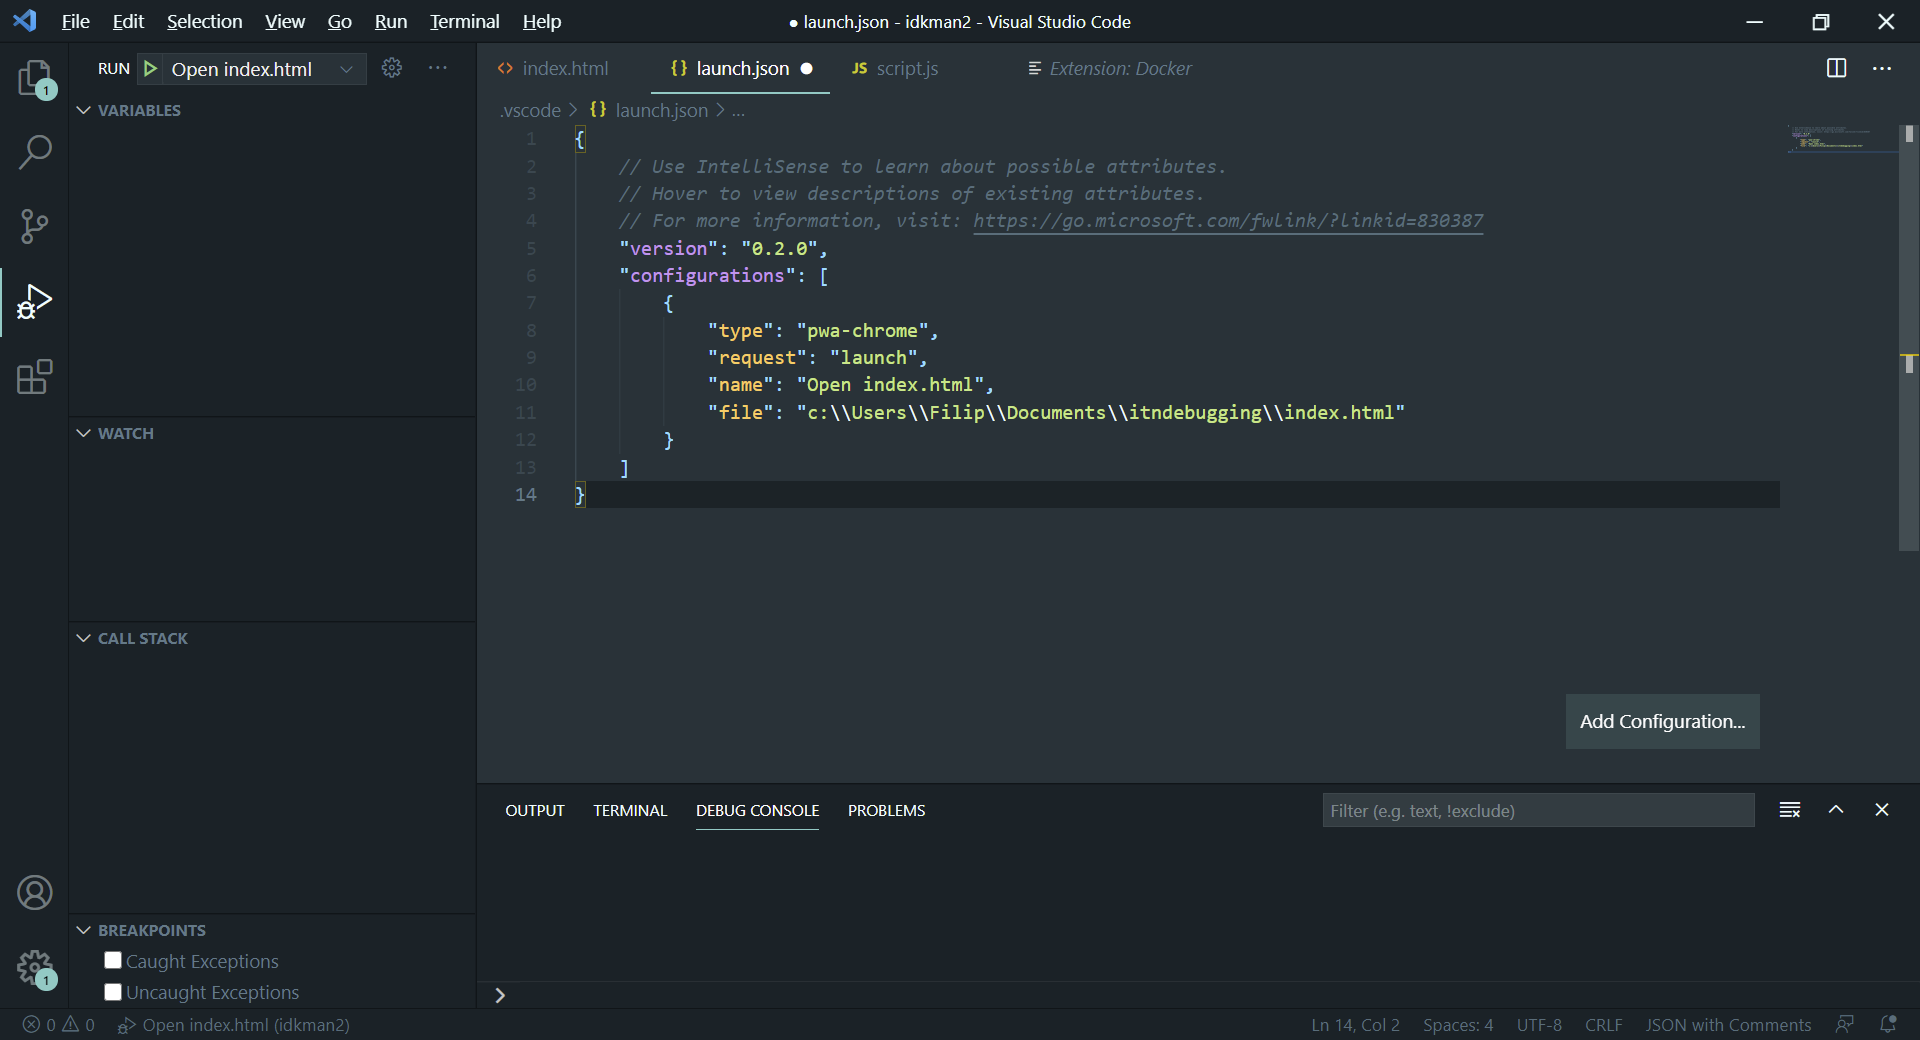
Of course, the file will not be and must not be the same as above, even some parameters may be different. In short, all you have to do is see if the path to the file is correct. We can check this if we try to run the file with the green arrow at the top left. If nothing is loaded for us, let's check what address we have written in the browser. They will advise us on what may be wrong. We can also generate this universal file with variables:
{
    // Use IntelliSense to learn about possible attributes.
    // Hover to view descriptions of existing attributes.
    // For more information, visit: https://go.microsoft.com/fwlink/?linkid=830387
    "version": "0.2.0",
    "configurations": [
        {
            "type": "pwa-chrome",
            "request": "launch",
            "name": "Launch Chrome against localhost",
            "url": "http://localhost:8080",
            "webRoot": "${workspaceFolder}"
        }
    ]
}
In this case, we have to specify the file we want to run there - the
file parameter. For example, the configuration will be as
follows:
{
    // Use IntelliSense to learn about possible attributes.
    // Hover to view descriptions of existing attributes.
    // For more information, visit: https://go.microsoft.com/fwlink/?linkid=830387
    "version": "0.2.0",
    "configurations": [
        {
            "type": "pwa-chrome",
            "request": "launch",
            "name": "Launch Chrome against localhost",
            "url": "http://localhost:8080",
            "file": "C:\\Users\\Filip\\Documents\\itndebugging\\index.html",
            "webRoot": "${workspaceFolder}"
        }
    ]
}
There must always be two backslashes in the path. One backslash is also used in programming or regular expressions. There is always a special character after the backslash. In our case, the special character is also a backslash, so we write two in a row.
Debugging example
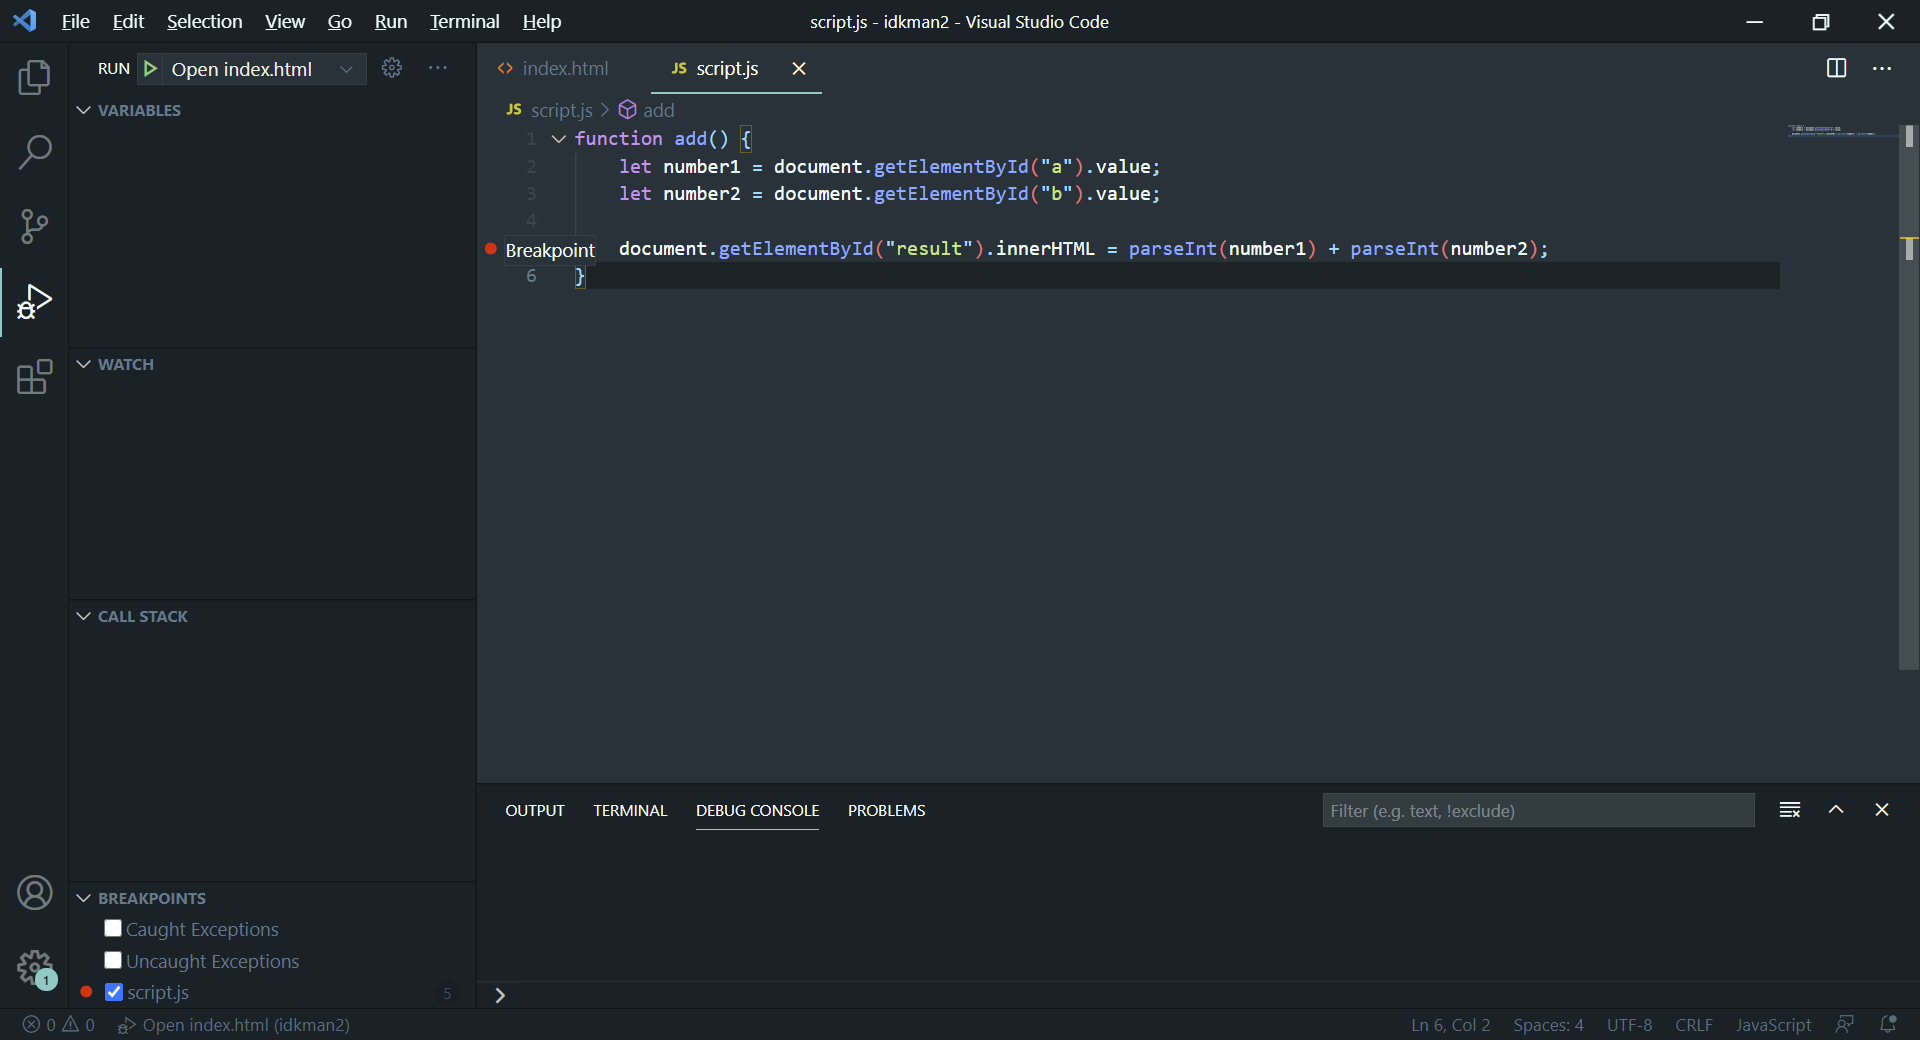
In Visual Studio Code, we can now add breakpoints directly in the program by clicking on the line number, as we are used to. Let's try this by adding a breakpoint to the line where the sum of the possibilities occurs:
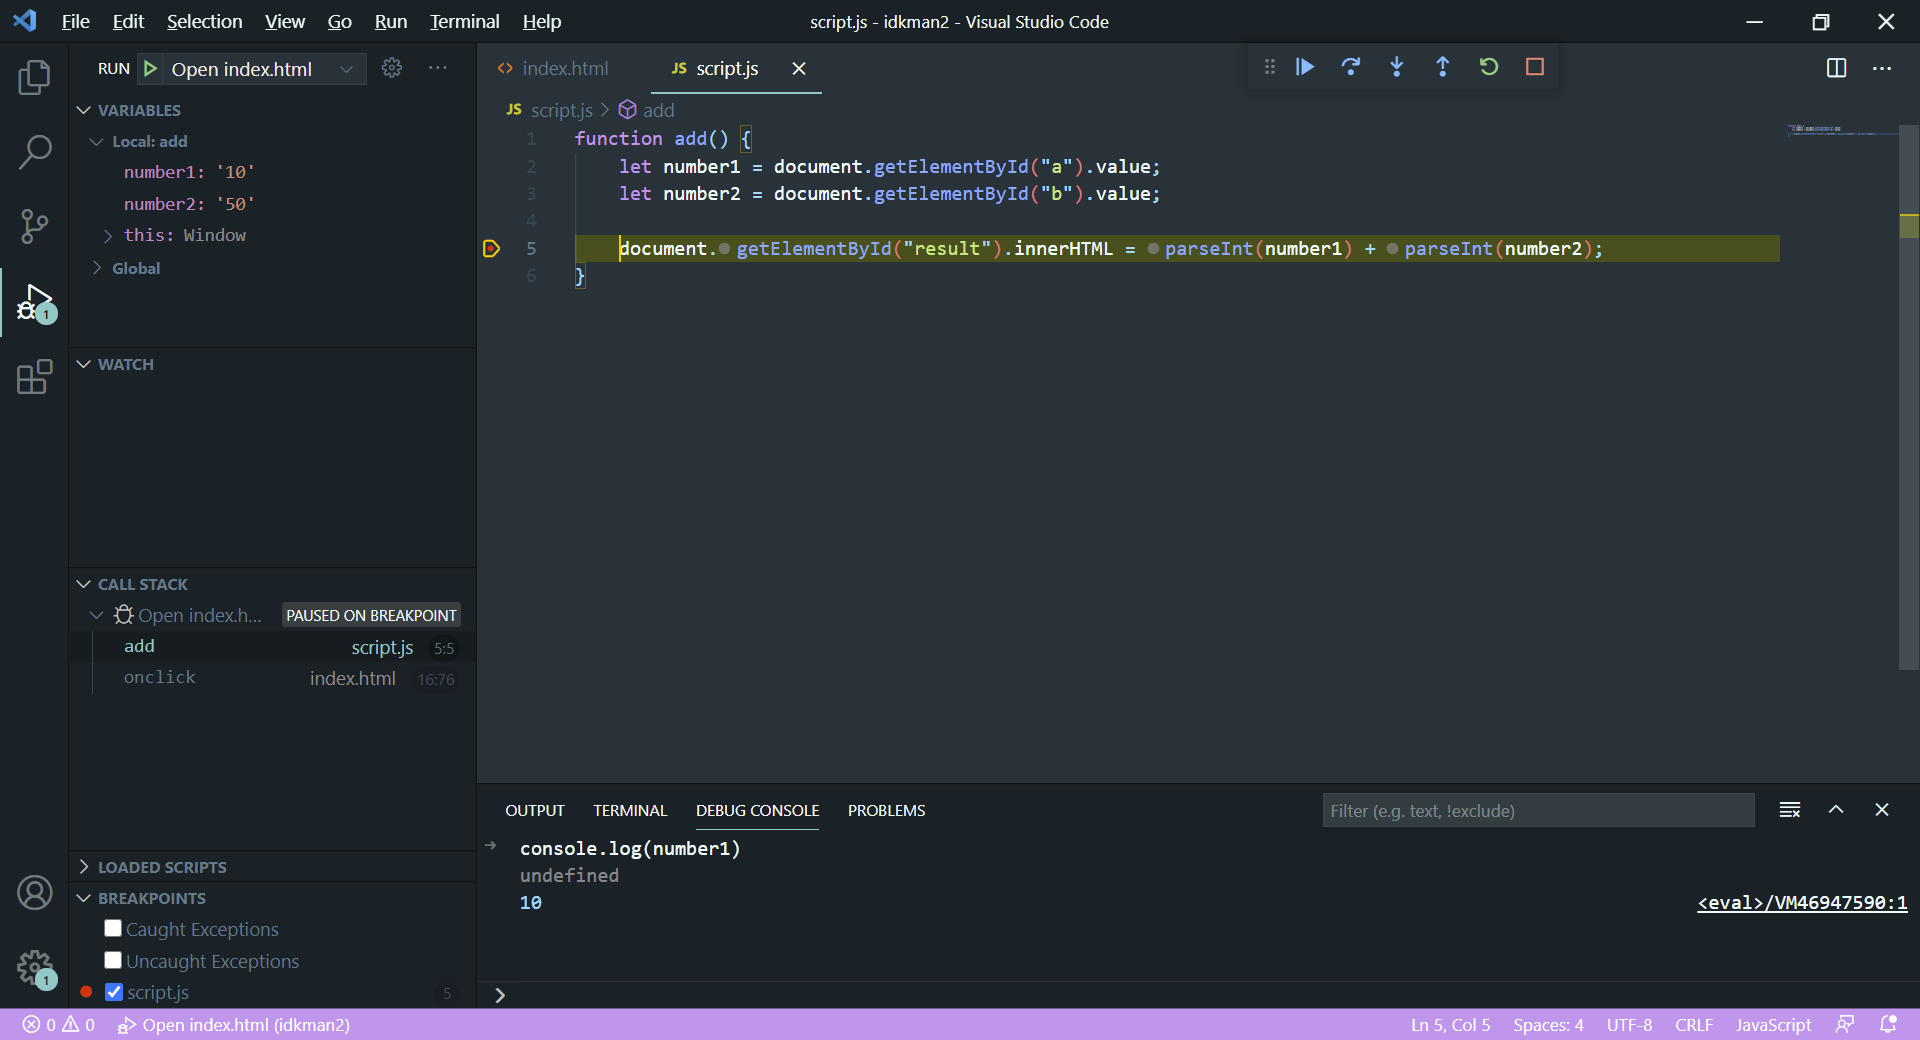
When we then run our program and call a breakpoint after entering two values
and pressing the Add up button, we get the debugging mode in Visual
Studio Code, which we should already be familiar with from Chrome. On the left,
we see the values of the variables, the option to add Watches, and at the bottom
also the console in which we can further debug. Also, of course, buttons to turn
the code on and off again:
In Visual Studio Code we can also set conditional breakpoints. To add a conditional breakpoint, right-click on the breakpoint and select the Edit breakpoint ... menu. Then we write the condition in the line that must be met for the breakpoint to be activated. For example, for the first number entered to be ten:
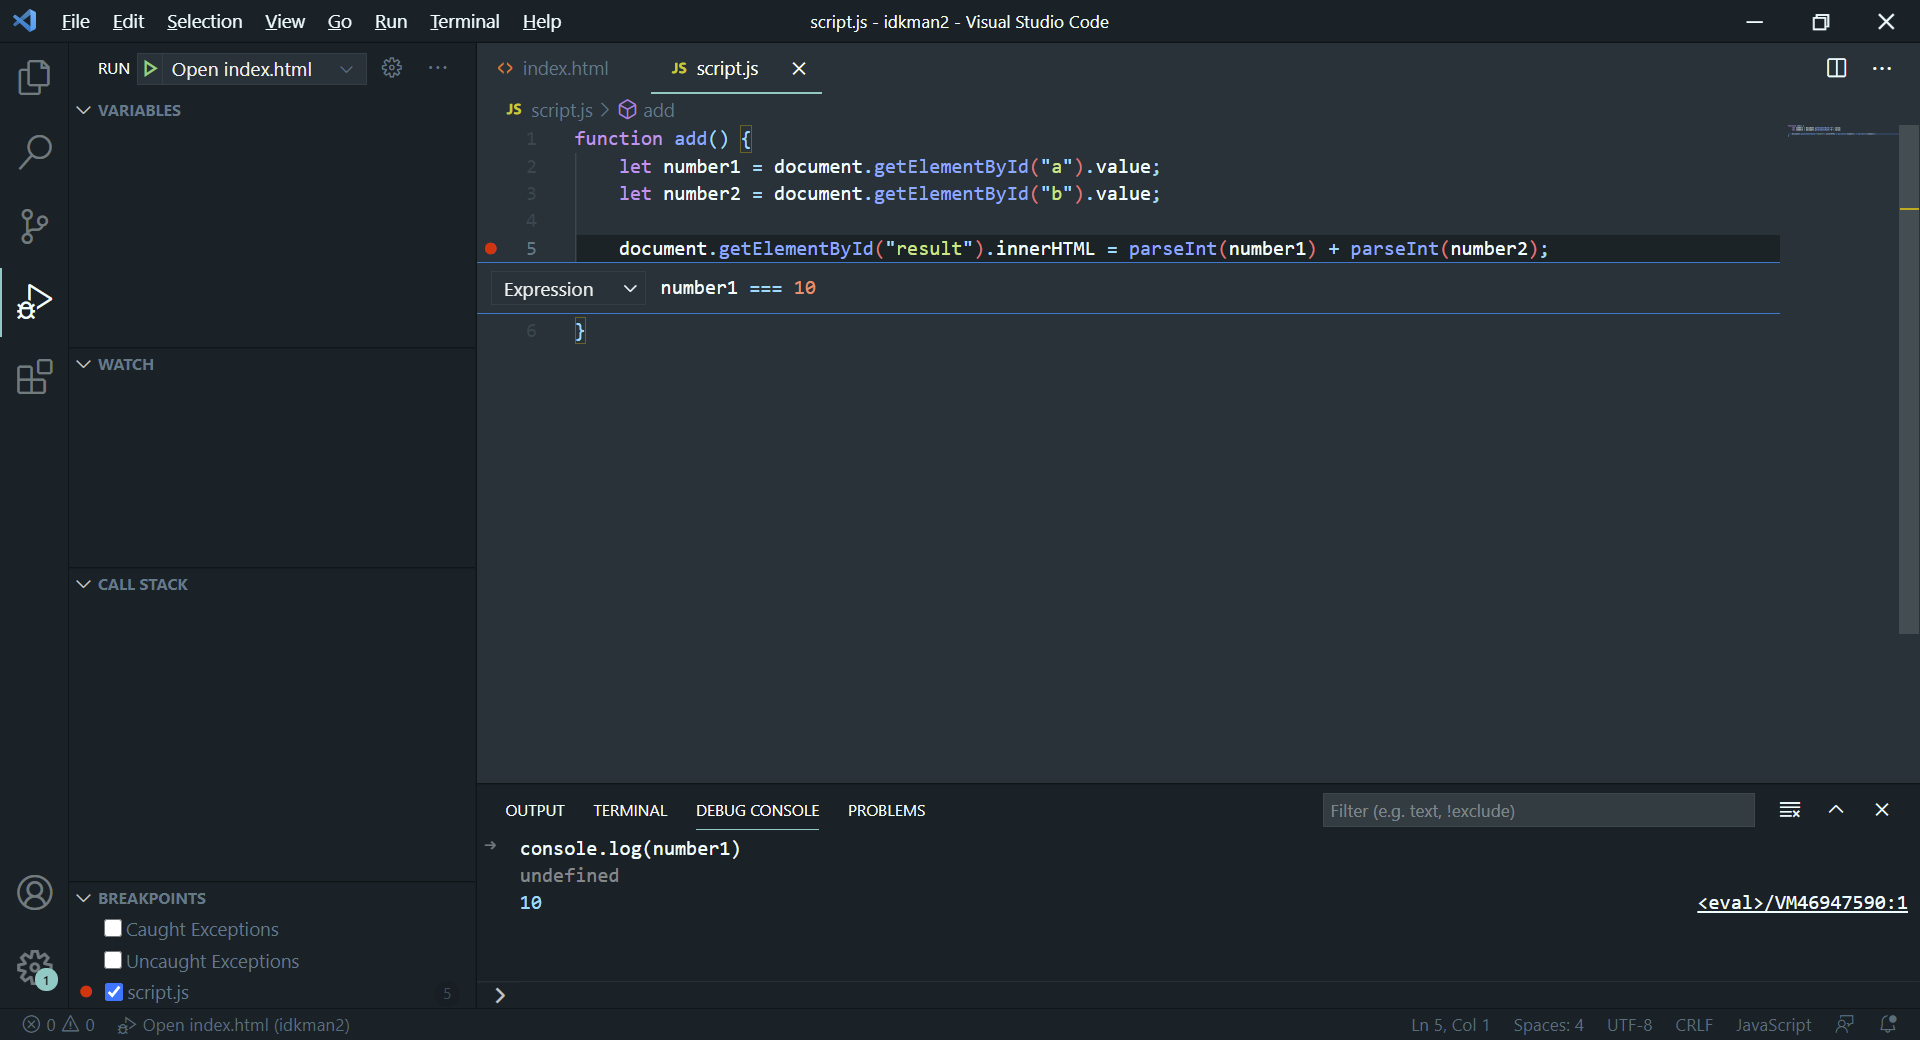
Now let's try to add the numbers 10 and 10 on the page. The program will not
stop. The more experienced ones of you probably know that === means
not only equality of value but also equality of data type. Since we took the
number from the text box, the data type is string (text string)
"10". However, we compare this string with an
int (integer) data type, and the two data types are not equal. So
if we want the breakpoint to start, it is necessary to enter two equals instead
of three equals == or leave three equals, but first, we will parse
the number number1:
parseInt(number1) === 10
In the next lesson, Debugging in the WebStorm development environment, we'll show you the specific WebStorm development environment and how it can be used for debugging.
Download
By downloading the following file, you agree to the license termsDownloaded 180x (1.38 kB)
